
Every so often the coffee industry throws up two numbers that seem to contradict each other: on one side Vietnam announces a harvest-year export value hitting a record US$8.5 billion; on the other, the International Coffee Organization’s (ICO) composite indicator price falls to 262.18 cents/lb, down 8.7% in a single month. Selling more, earning more, yet prices are falling—this set of numbers is not contradictory; they actually describe the same event from two different coordinates.
This article places the two coordinates side by side to explain what signals actually make up global coffee prices, how they are calculated, and—for procurement and operations in the Chinese market—which signals are worth watching and which should not be overreacted to.
I. The First Coordinate: Vietnam Sold a Record, but Not at a Record Price
At its 2025–2026 harvest-year review meeting, the Vietnam Coffee and Cocoa Association (VICOFA) disclosed that for the full harvest year Vietnam’s coffee exports reached about 1.8 million tonnes and about US$8.5 billion, both record highs. The breakdown is more interesting—export volume rose about 21% year-on-year, yet export value grew only about 1%.
“Volume up, price down” is the most accurate footnote to this harvest year. Customs data for the first nine months disclosed by Vietnamese official media show exports of about 1.45 million tonnes and US$6.57 billion, implying an average price of about US$4,524/tonne, down about 20% year-on-year. In other words, Vietnamese farmers and exporters had to sell about one-fifth more volume just to push total value barely to level with, and slightly above, the prior year.
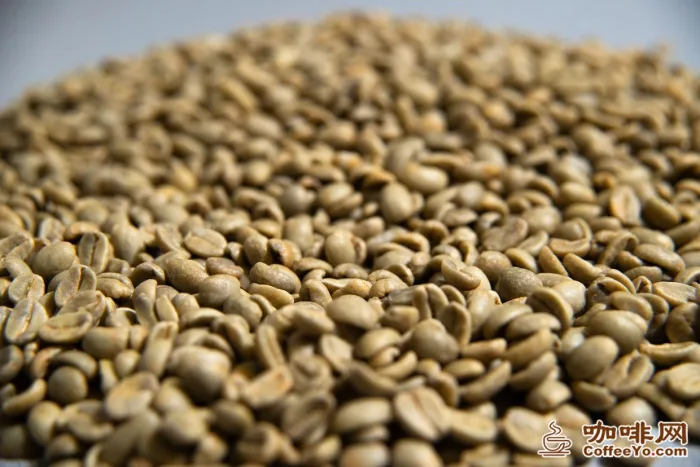
Structurally there is an even more notable shift: green bean exports of about 1.65 million tonnes and US$7.0 billion showed “volume up, value down”; while deep-processed products of about 142,600 tonnes and US$1.5 billion saw volume up about 15% and value up about 14%—their unit value was markedly more stable. Robusta accounts for over 90% of Vietnam’s export structure, with the EU as its single largest market at over 38% share.
II. The Second Coordinate: 262.18 Cents—How ICO’s “Composite Indicator Price” Is Calculated
When many people see “international coffee price” they immediately think of the New York or London futures screens, but the figure that actually describes global spot-trade levels is the ICO Composite Indicator Price (I-CIP) published monthly.
Its algorithm is not mysterious: coffee is divided into four groups—Colombian Milds, Other Milds, Brazilian Naturals, and Robustas—representative spot quotes are taken for each group, then weighted-averaged by each group’s share in global trade, yielding a composite number priced in cents/lb.
In September 2026 this composite indicator stood at 262.18 cents/lb, down 8.7% month-on-month. The emphasis on “composite” matters because at any given moment Arabica and Robusta trends often diverge: Vietnam, dominated by Robusta, saw its export average-price decline differ from that of Arabica-dominated origins. The composite price tells you the big picture; for specific procurement you must break it down to group prices.
III. From Four Years of Deficit to a 3-Million-Bag Surplus: The 2025/26 Turn
Since 2022, global coffee has been in a supply-short-of-demand deficit for four consecutive years, with inventories continuously drawn down—the root cause of the previous upward drift in the price center. But by current major-institution estimates, 2025/26 global supply and demand are expected to turn to surplus for the first time, by about 3 million bags (60 kg each).
The turn is mainly on the supply side: Brazil’s output recovering and Vietnam’s output rising to nearly 1.9 million tonnes (up about 6%–10% year-on-year), the two major origins releasing volume simultaneously. Demand is still growing, but its growth cannot keep pace with supply recovery.
Note that the switch from “deficit” to “surplus” does not mean prices will immediately fall in a straight line. Rebuilding inventories takes time, and weather, exchange rates, shipping, and geopolitics will all cause reversals; the market tends to swing between expectation and reality.
IV. EUDR: Compliance Priced for the First Time
There is one thread in this cycle different from past ones—the EU Deforestation Regulation (EUDR). It requires coffee entering the EU market to provide plot-level production proof that no deforestation occurred.
A reference figure from VICOFA: products that meet EUDR compliance can earn a premium of about US$50/tonne. This means “compliance” has for the first time moved from an administrative threshold to a cost and revenue item that can actually be priced.
For Chinese enterprises this thread has a dual meaning: first, raw materials exported to the EU must prepare plot-level traceability materials in advance; second, the domestic market’s demand for traceable, verifiable origins is also rising, and traceability capability is shifting from a bonus to an entry ticket.

V. Which Signals Should Chinese Enterprises Watch
Pulling the above threads together, for domestic procurement and operations there are roughly three actionable observation items.
First, group prices rather than the composite. If your formula is Robusta-based, watch Vietnam’s and Brazil’s Natural group quotes directly; if you do specialty Arabica, watch Colombian Milds and Other Milds. The composite’s rises and falls are only background.
Second, structure rather than total volume. The contrast of Vietnam’s green beans “volume up, value down” versus deep processing “volume and value both up” shows that whichever end retains the added value has stronger price resilience. Those doing raw-material trade need to re-evaluate the exposure risk of a green-bean-only approach.
Third, compliance cost. The ~US$50/tonne EUDR premium suggests that investment in traceability system building can be partly recovered on the selling side, changing the old ledger of “compliance as pure expense.”
Conclusion
US$8.5 billion and 262.18 cents: one is the seller’s report card, the other the buyer’s thermometer. Read together, global coffee in 2025/26 is in a very typical gearshift period: output is back, prices are down, compliance is starting to be priced, and the processing end stands more firmly than the raw-material end. Understanding these four changes is more valuable than staring at any single day’s quote.
Sources
① Data disclosed at VICOFA’s 2025–2026 harvest-year review meeting (export volume ~1.8M t, value ~US$8.5B, volume +~21%, value +~1%, green-bean vs deep-processed breakdown, EUDR compliance premium ~US$50/t); ② Customs first-nine-month export data disclosed by Vietnamese official media (~1.45M t, US$6.57B, avg ~US$4,524/t); ③ ICO September 2026 composite indicator price 262.18 cents/lb and the I-CIP group weighting method; ④ Major-institution estimates of a ~3M-bag surplus in 2025/26 global supply/demand; ⑤ Public requirements of the EU Deforestation Regulation (EUDR).
Note: This article is a synthesis of public materials and industry-logic analysis, and does not constitute any procurement, pricing, or investment advice; specific quotes are subject to trading platforms and contracts, and all data are subject to the official texts of the original issuing bodies.
Originality Statement
- This article is an original work of coffeeyo.com. Without authorization, no media, website, or individual may reprint, excerpt, duplicate, or otherwise use it; violators will be pursued under law.
- The images, charts, and videos herein are originally photographed or produced by Coffeeyo, with copyright watermarks added; copyright belongs to Coffeeyo.
- For reprint authorization, commissioned writing, interviews, or business cooperation, contact: Tel 400-0000-641 (+86-18288016826) | Email 405854472@qq.com | Address: Jinghong City, Xishuangbanna, Yunnan Province / Tieling City, Liaoning Province
Related Reading
- Severe Global Coffee Bean Shortage Turns Overseas Buyers Toward China’s Growing Regions
 Coffee and Health: The 400 mg Daily Caffeine Limit
- ICE Agricultural Futures Close Higher; Coffee Futures Up 1.72%
 Global Coffee Belt 2026/27 Outlook: Brazil Record Crop and the Volume-Up, Price-Down Equation
- Why Arabica Coffee Futures Fell Below .90: Brazil Rain and a Stronger Dollar
 Revaluing Yunnan Coffee: From a Raw-Material Base to a Flavour Origin


 Liaoning ICP Security No. 21122402000217