
Brief (coffeeyo.com): After selling its China business, Starbucks is left with only its North American company-operated core; revenue CAGR for 2026–2030 is projected at 6.5% and profit CAGR at 24%, but the current share price has already priced in the recovery, so it is not an ideal entry point.
After selling its China business, Starbucks is left with only its North American company-operated core; revenue CAGR for 2026–2030 is projected at 6.5% and profit CAGR at 24%, but the current share price has already priced in recovery expectations, so it is not an ideal buying point.
Key Points
1. Growth focus reduced to North America; China off the books becomes a cash asset.
After selling 60% of its China stake to Boyu, Starbucks retains only a 40% investment gain and royalty income; its growth elasticity depends entirely on the North American company-operated market, which contributes about 75% of revenue.
2. Small-store formats are an option on expansion, but near-term contribution is limited.
Pickup and double-lane drive-thru formats can cut construction costs by 20%–30% and shorten payback to 3 years, with potential space of 5,000–10,000 stores; but the official guidance is only ~400 new stores per year, so the near-term revenue increment is just 1%–2%.
3. The afternoon daypart is the core elasticity for same-store recovery.
Starbucks does 50% of its business before 10 a.m. and only 25% in the afternoon; through new products such as Energy Refreshers and an SKU iteration cycle of 8 months (4 months longer term), every 10% lift in afternoon sales can drive overall revenue by about 2.5%.
4. Profit-recovery expectations are fully priced in; downside risk outweighs upside.
Under Dolphin Research’s optimistic scenario — North American operating margin recovering to 21.6% (above pre-decline levels) — the current share price exactly corresponds to fair value, meaning the market has already completed the pricing of “successful recovery.” Buying now only earns money from beating expectations.
5. Cost-optimization assumptions support high profit growth.
The store operating expense ratio is assumed to fall from 45.9% to 39.8% by 2030, combined with same-store turning positive in 2026 (+5.5%) and stabilizing at +4% after 2027, supporting a 24% profit CAGR — but realization depends heavily on releasing operating leverage.
In the previous piece we clarified what kind of company Starbucks is: a cash cow that relies on brand and “third space” premium to support nearly 70% gross margin, can absorb stored-value float like a bank, and for years has bought itself into negative equity through buybacks and dividends. But a good company does not necessarily equal good growth or a good asset.
In this piece, Dolphin Research answers another question: with U.S. same-store sales having turned negative in recent years, China “lost,” and growth sluggish, how much is this cash cow actually worth?
I. How is Starbucks’s future growth?
Before talking about growth, we must first clarify a core premise: where exactly should we look for growth?
In fact, after the deal to sell the China business closed in April (60% of China equity sold to Boyu, nearly 8,000 stores licensed out and off the books), Starbucks’s growth map was completely restructured — the China market bid farewell to its positioning as the second growth curve under consolidated reporting, and now only contributes investment income from the remaining 40% stake, plus royalty income accrued by revenue ratio, thoroughly “degenerating” into a high-margin but low-ceiling cash-flow asset.
Other international markets are also mainly licensed, contributing stable but inelastic “brand royalties.” In other words, what now determines Starbucks’s growth quality and valuation elasticity is a single main battlefield — North America, which contributes about three-quarters of revenue and remains predominantly company-operated and asset-heavy.
And North American growth includes both store-opening potential and same-store operating-recovery elasticity. Below, Dolphin Research breaks this down one by one.
Growth Logic 1: Small-store formats open up U.S. store-opening space
Historically Starbucks stores were often around 200-plus square meters, with extremely high construction and site-selection thresholds — dense on the East and West coasts, relatively sparse in the middle.
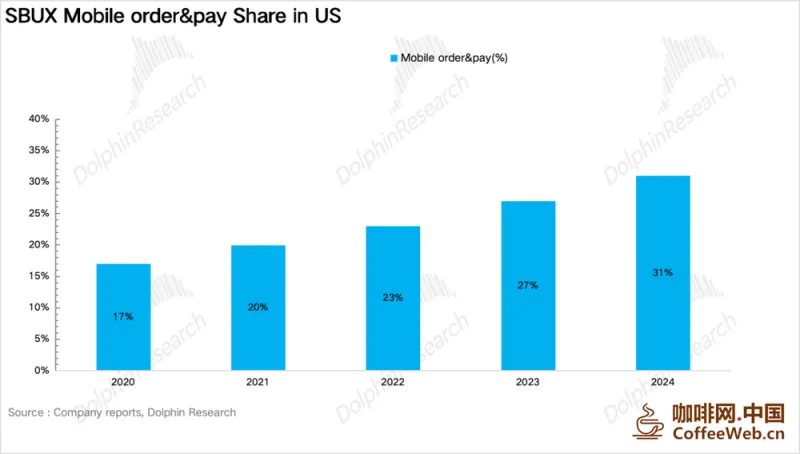
But in fact, North American consumers’ behavior has changed significantly in recent years: as the chart below shows, the share of mobile orders rose from 17% to 31% over five years, nearly doubling.
This also makes the traditional 200–300 sq m standard large stores show obvious spatial redundancy in a consumption scenario dominated by ultra-fast pickup.
Against this backdrop, Starbucks chose a dual-track growth route of “optimizing existing stores for experience, adding new stores for efficiency”:
For existing stores, as the core repair action of the “Back to Starbucks” strategy, the company launched the Coffeehouse Uplift program, planning to complete light renovations of 1,500 North American stores by end-2026, adding sofa seating and power outlets to reinforce the “third space” stay attribute, hedge against the homogenization of consumption scenarios, and stabilize the core loyal customer base.
On the incremental side, Starbucks introduced two lightweight store types suited to large volumes of non-in-store orders: first, Starbucks Pickup pure pickup stores, with almost no dine-in seating, designed for advance App ordering, located in high-density urban business districts and subway hubs in New York, Chicago and similar cities; second, Double Drive-Thru two-lane car-friendly stores, aimed at suburbs and highway hubs, compact in format, equipped with two lanes and a dedicated online-order pickup window, maximizing vehicle throughput efficiency.
Taking the next-generation standalone small-store prototype disclosed at the company’s Investor Day (32 seats, with a drive-thru lane, building area about 125 sq m) as an example, its construction cost is 20%–30% lower than a traditional standard large store, and the single-store payback shortens from 4 years to about 3 years — meaning many lower-tier midwestern towns whose models were previously hard to make work regain store-opening feasibility.
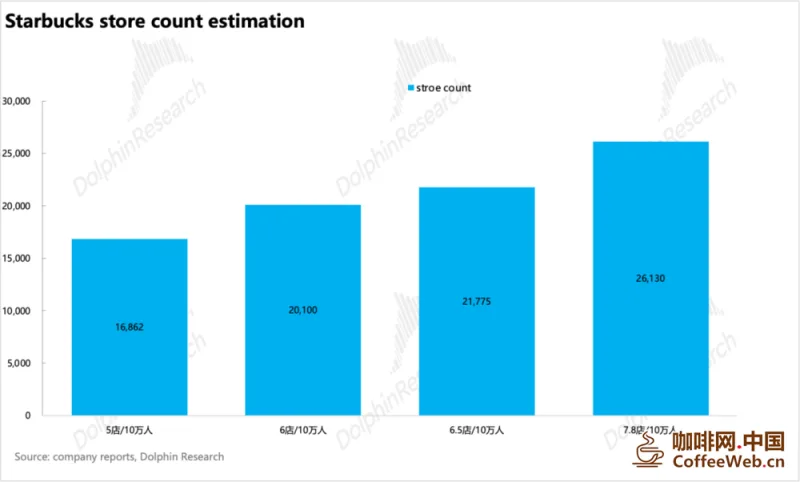
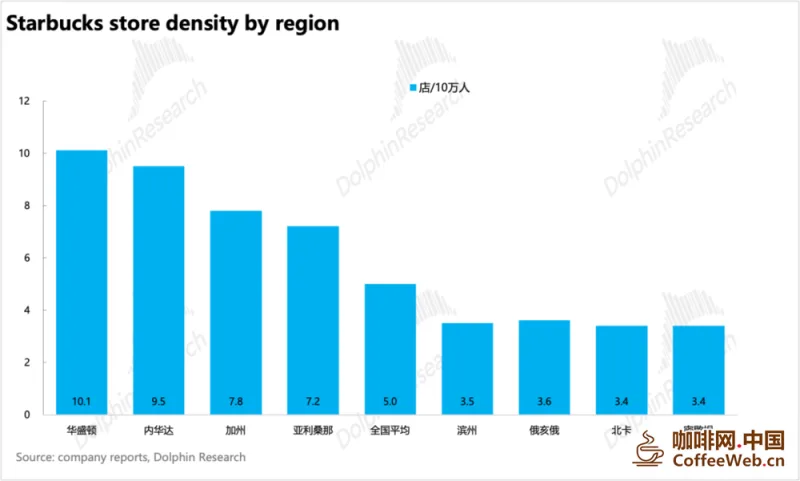
A simple estimate: at current population density, Starbucks in North America is basically 5 stores per 100,000 people; assuming national density approaches that of mid-to-high-density states (6.5 stores/100k), the U.S. total would be about 21,800 stores, an increment of about +4,900; if further benchmarked against California (7.8 stores/100k) — considering small-store formats greatly lower the threshold for individual sites — the total would be about 26,100 stores, an increment of about +9,300.
This roughly matches the company’s bottom-up guidance — about 5,000 more company-operated stores (to about 22,000), or up to 10,000 more including licensed stores.
In Dolphin Research’s view, Starbucks’s motivation behind betting on small-store formats lies in:
a. Lowering single-store capital expenditure and optimizing payback: with North American interest rates and construction costs still at highs, small-store models like Pickup and double-lane drive-thru have smaller areas and lower hard-fit and ancillary investment. Under the same capital-expenditure scale, the company can open more new stores, dilute per-unit investment pressure, and improve single-store return cycles.
b. After network density rises, drive down the marginal costs of digital business and delivery: the China market has already proven that mobile order-and-pay plus delivery can achieve a high online-order share.
If the U.S. fills in small-store networks in suburbs and central markets, mobile pre-order and drive-thru order throughput will be smoother; broader store coverage will also provide better ground for the Green Apron Service standardized operating system (analyzed later), further releasing store beverage-output efficiency.
However, from official guidance, the mid-term (2028) expansion vision for U.S. company-operated stores remains at about 400 per year. Compared with market estimates of a long-term potential of 5,000–10,000 lightweight stores in North America, landing at the current pace would take more than a decade.
This also shows that management’s current core goal is not aggressive front-running to quickly fill all potential sites, but to prioritize proving out the business models of Pickup and double-lane drive-thru, refining single-store returns, operating processes and digital adaptation capabilities.
On the revenue side, about 400 net new U.S. company-operated store openings per year, combined with new-store ramp cycles and the naturally lower per-store sales of lightweight formats, means store-opening contributes only an estimated 1%–2% annual revenue increment.
Therefore, before the company raises its store-opening guidance and accelerates expansion, North American small-store expansion is more of a mid-term value option and cannot become a core near-term performance driver.
Growth Logic 2: The afternoon daypart opens a “second growth curve”
A set of structural data the company repeatedly mentions in industry exchanges: about 50% of Starbucks’s business occurs before 10 a.m., and 65% before noon, showing the morning peak is already quite saturated — squeezing more orders from the morning peak yields low marginal returns.
But it also means that once the afternoon is cultivated into a second traffic peak, putting the same revenue in the afternoon is “more cost-effective” than in the morning peak — reusing existing store staff and equipment without greatly increasing fixed investment, so incremental orders carry higher margins.
But considering caffeine demand is naturally concentrated in the morning, the sensible approach is to use new categories to match new afternoon demand:
Dolphin Research sorted out Starbucks’s new afternoon products in the chart below; the current product layout basically revolves around two main lines: the non-coffee track plus natural energy supplementation.
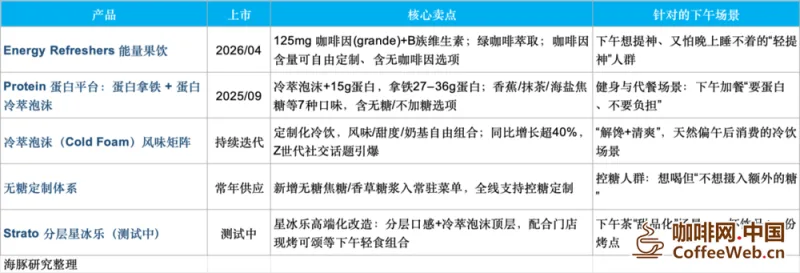
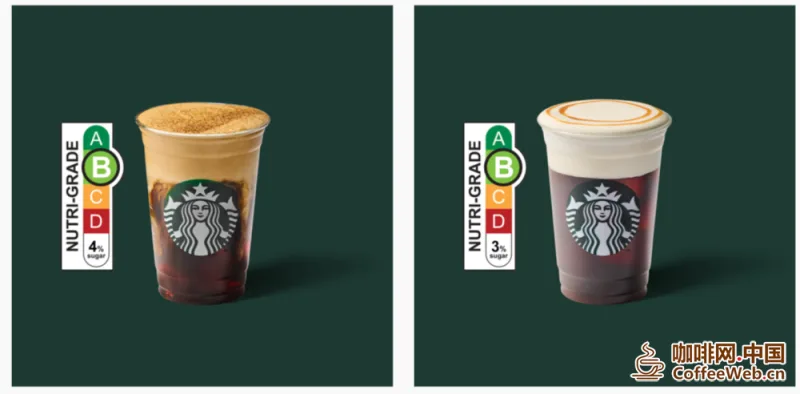
Combined with research information, Refreshers iced fruit drinks (with the hit Pink Drink as representative) have now achieved high-speed growth and become the second-largest beverage base after traditional coffee.
On this basis, Starbucks further launched Energy Refreshers with added natural plant extracts and rich B vitamins, as well as matcha specialties, precisely targeting the pain point of young customers who want an afternoon pick-me-up but resist coffee’s bitterness and worry that high caffeine will affect nighttime sleep.
A more critical change is that Starbucks is compressing its new-SKU development cycle from the original 18 months to 8 months (with a longer-term target further down to 4 months); this enables a new-product iteration every 3–4 weeks, continuously supplying freshness to the afternoon consumption daypart. Specifically:
a. Using real-time data + AI to replace annual research, precisely locking new-product directions.
Starbucks launched its in-house AI machine-learning platform Deep Brew in 2019, which processes about 100 million transactions per week, enabling near-real-time monitoring of consumption trends across dimensions such as flavor, ingredients and consumption time, quickly capturing market-demand changes. In 2024, Starbucks further embedded generative AI into the system for screening and generating new-product recipe concepts. New-product development no longer relies solely on R&D staff experience and subjective judgment, shifting to a data-driven model that alone can save months of trial-and-error in the early direction-research stage.
b. Agile reconfiguration of the R&D chain:
Although Starbucks’s Seattle headquarters innovation center, the Tryer Center, was built as early as 2018, much of its energy was previously consumed optimizing Siri/App voice ordering, testing cold-brew machines, and refining delivery packaging — technical and logistical areas — without concentrating on solving the two most fatal pain points: “core product innovation” and “baristas’ peak-hour misery.” A product tested at the Tryer Center takes a long, layered approval process through marketing, supply chain, regional operations, compliance and other departments before truly reaching the market, with a protracted decision chain.
Niccol, formerly CEO of fast-casual chain Chipotle, after taking office launched the Starting 5 program: a prototype completed at the Tryer Center is immediately placed in 5 stores for stress testing, quickly validating core metrics such as new-product output stability, employee operation difficulty and consumer acceptance, completing effect verification in weeks. After passing, it is rolled out nationwide — doubling test efficiency while screening out inferior products early and holding the quality-control bottom line, a principle highly aligned with SHEIN’s “small-batch, fast-reorder” model.
c. Platform architecture + efficient replenishment:
No matter how fast R&D and testing are, whether high-frequency new launches are ultimately possible hinges on the supply chain. The essential reason Starbucks dares to compress its new-product cycle to the extreme is the reconfiguration of its supply-chain system. Currently, main categories such as Refreshers fruit drinks, cold foam and Cake Pop desserts are all built on a mature, market-validated common product base. Most subsequent launches are essentially just changing flavor, ingredients and form on that base — the supply chain need not be rebuilt, store equipment need not be modified, and employees need not relearn procedures; they just memorize the new recipe parameters.
More critically, this greatly reduces innovation risk: since the underlying product base is already proven in the market, even if a new flavor sells poorly, it will not affect the stable operation of the entire product line — only a single-flavor iteration miss, with extremely low loss. In addition, the industry previously adopted a model of full-case minimum orders and 72-hour delivery, so nationwide rollout of new products took weeks, and stores were easily forced to stockpile and build up inventory. After Starbucks switched to single-unit replenishment and 24-hour daily delivery, efficiency and flexibility also improved substantially: once a new product is finalized it can quickly blanket all national stores, and the launch rhythm is no longer dragged down by the supply chain.
Combined with earnings-call information, in effect Starbucks’s afternoon daypart has seen both same-store traffic and average ticket rise; what is rarer is that almost all this increment is carried by iced drinks and customized products, without crowding out the morning peak’s coffee capacity.
A simple estimate: the 12:00–17:00 afternoon daypart currently accounts for about 25% of Starbucks sales; using North American company-operated revenue of about $27 billion as the base, every 10% lift in afternoon sales drives overall revenue by about 2.5% (about $680 million); if it can achieve a 20% lift, the drive is 5% — about $1.35 billion — almost equal to the sum of two or three years of net new-store contribution, clearly the highest “cost-performance” increment for Starbucks at present.
II. How to view Starbucks’s value?
1. Same-store operating recovery as the core driver
Let’s first look at the earnings forecast:
On store-opening pace, combining the preceding analysis and the company’s guidance on its earnings call, Dolphin Research assumes North America in 2026 and 2027 focuses mainly on existing-store renovation and single-store ROI recovery, opening 150–200 new stores on average per year; from 2028, after the new single-store model is proven, the store-format structure formally shifts toward lightweight, and the opening pace accelerates, averaging 400–500 new stores per year. For Starbucks’s licensed stores, because they are highly concentrated in closed or specific scenarios (such as Target and other big-box stores, airports/stations, university campuses and hospitals), penetration across the U.S. is near a bottleneck; Dolphin Research assumes a small number of newly built quality-scenario licensed stores each year offset closures of inefficient existing stores, with no further growth. The specific store-opening pace can be referenced in the chart below:
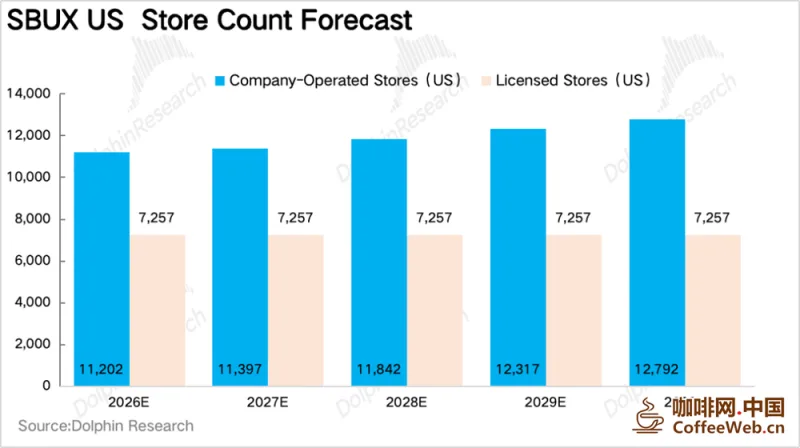
Based on the above assumptions, by 2030 Dolphin Research estimates Starbucks’s North American store count will reach 20,049, up about 10% from current;
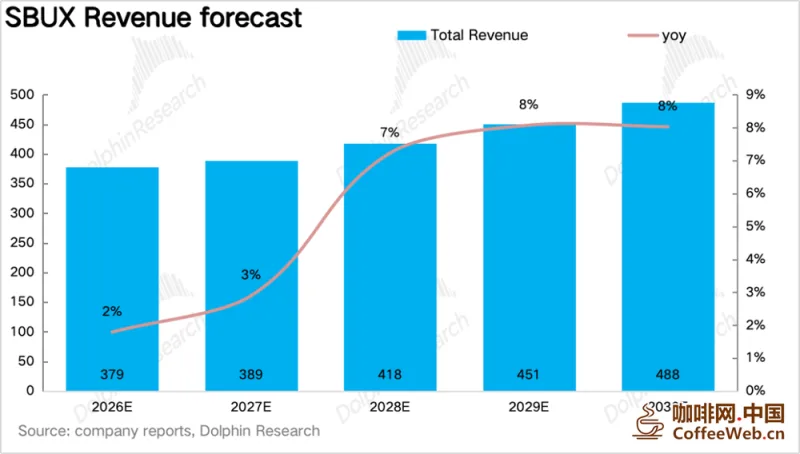
On same-store revenue, although under high inflation consumers’ doubts about the “value for $6 a cup,” combined with the backlash on store experience from mobile-order congestion, caused North American same-store to decline slightly for two consecutive years from 2024 (FY2024 −1.5%, FY2025 −1.8%, with traffic pressured for seven consecutive quarters). But after Starbucks’s proactive “deep self-cure” in 2025 — new CEO Niccol launched the “Back to Starbucks” strategy upon taking office, greatly optimizing the ordering algorithm, cutting 30% of redundant SKUs, renovating more than a thousand stores and re-adding store staff — North American same-store turned positive in Q4 2025 at a low base, with a traffic inflection point emerging. Therefore, Dolphin Research makes a relatively upbeat assumption for 2026 North American same-store (+5.5%) — on the one hand a low base after two years of decline, and on the other hand, the experience repair of “Back to Starbucks” and the volume of new afternoon-daypart products, per the earlier estimate, mean just a 10% lift in afternoon sales can drive overall revenue by about 2.5 ppt. From 2027 onward, as the low-base effect fades and store renovation and menu optimization become routine, we assume North American same-store gradually falls back to +4.5%, stabilizing at about +4% in FY2028–2030 — returning to Starbucks’s historical normal years. As for international markets, after China went off the books and became mainly licensed stores, the direct impact of same-store on the financial statements has greatly weakened; Dolphin Research uniformly assumes mild low-single-digit growth (EMEA about +1–2%, Asia-Pacific about +2–3%), not a main source of performance elasticity. Based on the above assumptions, Dolphin Research’s expectation for Starbucks’s revenue over the next five years is as follows: revenue CAGR for 2026–2030 can basically achieve 6.5% compound growth.
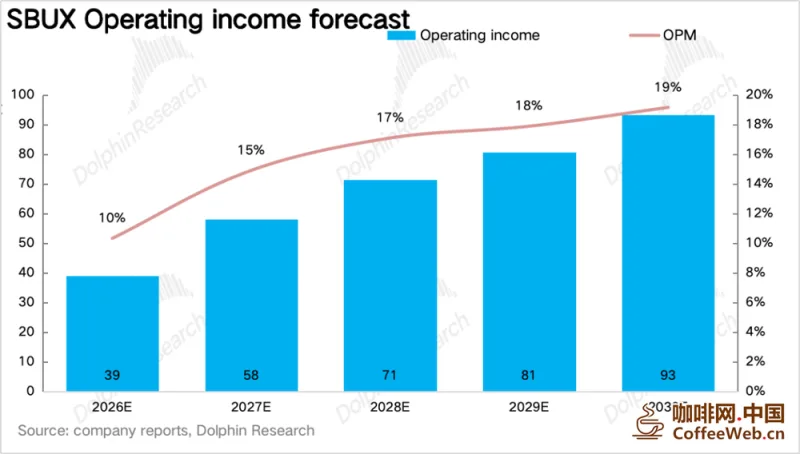
On the expense side, Starbucks’s big expense items are store operations and headquarters management. The store operating expense ratio, due to the proactive “Back to Starbucks” additional labor hours, once stalled at a historical high of 46% in 2025; Dolphin Research assumes that as same-store turns positive and releases operating leverage, and with Green Apron standardization and continuous labor-efficiency improvement, the store operating expense ratio gradually falls from 45.9% to 39.8% by 2030, while the management expense ratio, along with organizational streamlining and digital efficiency gains, falls from 7% to 5.1%. Ultimately this corresponds to operating margin recovering from a bottom of 10% to 19%, a 24% profit-growth CAGR.
2. A good company, but the market has already priced in the recovery of store profitability
Reviewing Starbucks’s historical valuation, we can see its valuation level is highly correlated with same-store growth; excluding extreme years, Starbucks’s PE enjoys a stable leading premium (the world’s No. 1 coffee brand, counter-cyclical same-store, unshakable buybacks and dividends).
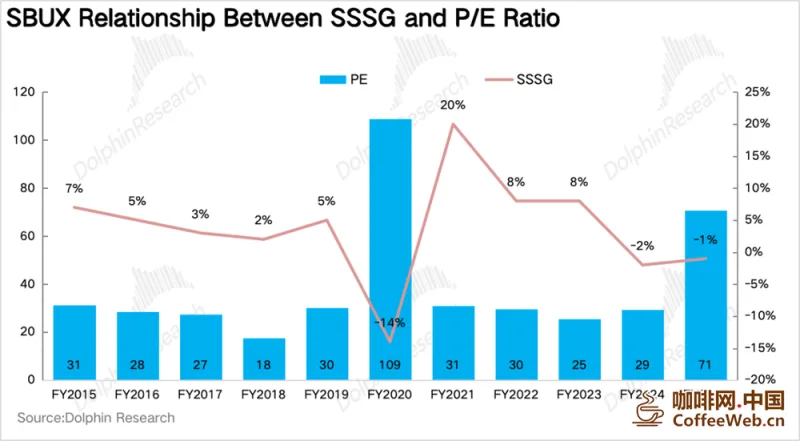
The current price happens to equal the fair value under Dolphin Research’s fairly upbeat earnings scenario (North American operating margin recovering to 21.6%, slightly exceeding pre-decline levels) being fully realized. In other words, the market has already priced in the “profit-margin recovery success” script.
Summary: A good company, but not a good strike zone
Combining the analysis of both pieces, we can see Starbucks is step by step transforming from an “asset-heavy restaurant operator” into a hybrid of “North American cash cow + global brand licensor,” pointing directly at the re-rating path McDonald’s took back in the day. Analogous to Guming in tea drinks — Starbucks in the U.S. is also a company strong on both attack and defense: on defense, it has the base built by renovated stores and member float, plus an annual 4%–5% buyback-and-dividend base; on attack, it has the same-store elasticity of the afternoon daypart, the store-opening option of small-store formats, and the valuation option of asset-light transformation. But a good company does not equal a good buying point. Considering the market has already priced in the “profit-margin recovery fully succeeds” script, buying at the current price essentially can only earn “beat-expectations” money, while the downside must bear the double-kill risk of the recovery being disproven.
Source: Compiled by China Coffee Network (coffeeyo.com) based on Dolphin Research analysis.
Reprint Note & Disclaimer
- This article is reprinted from Chinese media for information and cultural exchange. The views expressed are those of the original author and do not necessarily reflect the position of coffeeyo.com.
- All trademarks, brand names and logos mentioned belong to their respective owners.
- For cooperation, reprint or correction requests, please contact coffeeyo.com.
Reprint Notice & Disclaimer
- This article has been edited and compiled by China Coffee Network. The information and images therein come from public sources and the copyright belongs to the original author. This reprint is intended solely for information sharing within the coffee industry and does not represent the views of this website; all data and opinions are subject to the original article. Our thanks to the original author for creating and sharing it.
- For matters concerning content licensing, attribution, copyright or otherwise, please contact us promptly and we will verify and cooperate in handling them as soon as possible. We also welcome coffee origins, brands and industry media to exchange ideas and contribute articles.
- Contact China Coffee Network: Tel 400-0000-641 (+86-18288016826) | Email 405854472@qq.com | Address: Jinghong, Xishuangbanna, Yunnan Province / Tieling, Liaoning Province
Related Reading
 ‘All-Ice’ Coffee Goes Viral! Will the Next Hit Be Your Personal Favorite?
- Hong Kong’s Dyee Coffee Lands in Qianhai, Building a Specialty Pour-Over Outpost
 Ken Yue Coffee Opens Egg-Tart Pop-Up in Hangzhou: Sweet Craft, Reinvented Classics
 World Cup Enters the Breakfast Slot: Can Coffee-Tea Brands Turn Traffic into Orders?
- ICE Agricultural Futures Mostly Rise at Close; Coffee Futures Up 3.28%
- ‘Sleep Cafés’ Become a New Favorite Among Seoul Office Workers


 Liaoning ICP Security No. 21122402000217